Technical problems, a solution and Rackspace cloud monitoring
Some of you may have noticed that my blog experienced some technical difficulties yesterday morning.
For some reason I couldn’t find out the IIS still served static files, but anything that had to do with code like this Blog, my TeamCity, YouTrack, Stash and Fisheye applications did not respond anymore. The sad thing was that I even couldn’t RDP into my VM, and so I had to trigger a reboot through the hosters web interface.
What I really disliked was that I noticed the problem only when I wanted to log into my blog to check for comments and spam. To improve that I thought about monitoring my server or better the services it runs. So I asked Google to suggest some monitoring solutions that could help me out.
First hit
The first hit was Rackspace Cloud Monitoring. The price of 1.50 USD / month is great because I don’t want to spend a lot for checking my private stuff, but everything at about 5€ / month would be okay for me. The feature set described on their homepage was okay for me. What I really need is some service that makes a request against my blog and checks if it returns a 200 status code, and alert me if this is not the case.
So I signed up for a Rackspace cloud account. After a few minutes I got called to verify my account and the guy on the other end of the line offered help for getting started with them. I really like this approach, because it really takes down the barriers.
My first and single difficulty
After I signed up and was activated I logged into the management portal and looked for the monitoring options. Guess what? Nothing there. Their homepage stated it should be easy to configure the monitoring through the portal, but I could not find an option.
I tweeted about that and almost immediately I got a response with a link to a getting started video. Honestly, this was the point where I was really impressed. The Rackspace community obviously is very strong and willing to help. That’s great.
So, watching the video I learned that I could set up monitoring for a VM that I host on Rackspace, but if I delete that VM the monitoring setup would vanish too. Nothing for me, because I don’t need a VM but just the monitoring.
After tweeting about that I got this very helpful response:
@PhoenixHawk @pinojo Yeah, that’s not in the control panel UI, either the API or may be able to do it here https://t.co/dzcLYdxfzY
— rch (@cioj) June 25, 2013
I didn’t want to use the API, because I actually wanted to easily click together my simple 200-check. So I tried out this labs-GUI.
The setup
I didn’t dig into the documentation before I started. Actually I thought it should be possible to figure out how to set up a simple HTTP monitoring by just clicking through it. The labs GUI is a very basic Twitter Bootstrap interface that just enables you to access the functionality. Right now there is no real UX, but that’s okay. It works ;-)
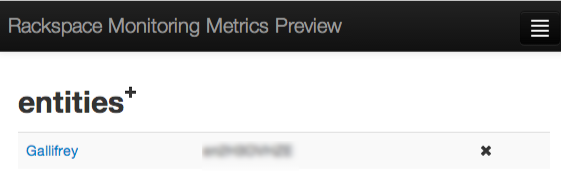
First I entered an ‘Entity’. I thought this would be the thing to monitor, so I entered ‘Gallifrey’, the name of my server. Turned out I got it right. What I could do additionally is to install a monitoring agent on Gallifrey to have it send data about CPU, memory and disk usage to Rackspace that I could use for my monitoring too.
For this entity I now could add a ‘Check’. I named it ‘Blog’ as I wanted to check the blog on Gallifrey.
Here I could configure that this is a HTTP check, the URL to test and from which locations Rackspace should test this. I checked London and two U.S. locations as 3 zones cost the same as just a single one.
Now, this check alone won’t help me. I need to tell the system what to do after a check and what are the error and ok conditions: Enter ‘alarms’.
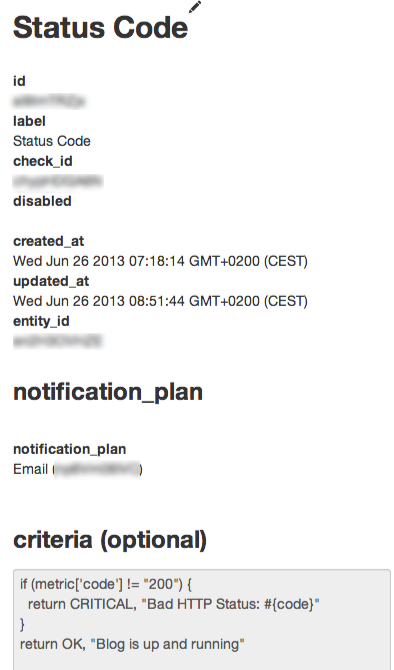
Alarms are the actual thing I want: A mail, whenever something goes wrong. The alarm is fed with the information from the check, evaluates it by rules I enter (the something) and where to mail the information to.
I started with my status code check (see screenshot on the right).

For the check language I had to check the documentation, but the samples are very self-explanatory so that I had this check running in minutes.
I then added another step that should notify about the performance of my blog. For this I used this check:
[javascript]if (metric[‘duration’] > 2500) { return CRITICAL, “HTTP request took more than 2.5 seconds, it took #{duration} milliseconds.” } if (metric[‘duration’] > 1800) { return WARNING, “HTTP request took more than 1.8 seconds, it took #{duration} milliseconds.” } return OK, “Overall performance is okay: #{duration} milliseconds.”[/javascript]
The values may seem a bit high, but since two of the three check locations aren’t in Europe I have to take some transatlantic latency into account. These values seem to work, because with lower values I already got quite some mails warning me that the performance seemed low ;-)
Noticing the alerts
To be really notified I created an filter in my e-mail account that marks the mails with ‘critical’ or ‘warning’ status as important. This way I get notified directly because I don’t let my phone notify me of every mail I receive.
Conclusion
Rackspace is very fast, easy to use and has a great community that helps you getting started in minutes.
With just about 15 to 20 minutes effort and a current investment of 1.50 USD / month I have a very easy to set up and hopefully reliable monitoring for my personal blog. This way I can react faster when something strange happens.
Disclaimer: I’m just a new customer of Rackspace and not related to them in any other way than that I’m paying them to monitor my blog.
